Collecting GCP info and system metrics for Honeycomb
Categories:
For a new and exciting project, the team is currently onboarding on Google Cloud Platform (GCP) development.
I can’t wait until I’m able to share more, but for now I can only say we’re looking at a Sinatra-hosted Ruby API server. To gain a better understanding how the service is performing, we want to collect some “traditional” metrics. Since we’re already using honeycomb for tracing tests and API calls, looking into honeycomb for more was my first choice. Most of the content here is based off the “Getting Started With Honeycomb Metrics” whitepaper at [https://www.honeycomb.io/white-papers/], made specific to Ruby and GCP.
Static runtime information
The first thing to collect is some static information about the container runtime hosting the current process. We’re using Cloud Run as our primary deployment infrastructure for the API services, so this is our first stop. The metadata server provides details about the container instance as described in “Container instance metadata server”.
The GCP ruby gems provide Google::Cloud.env to access the metadata server.
Here is a pruned example of how to add metadata to all spans for easy filtering:
require 'honeycomb-beeline'
Honeycomb.configure do |config|
  config.service_name = 'backend'
end

env = Google::Cloud.env
Honeycomb.client.libhoney.add_field('gcp.project_id', env.project_id)
Honeycomb.client.libhoney.add_field('gcp.instance_id', env.lookup_metadata('instance', 'id'))
Honeycomb.client.libhoney.add_field('gcp.instance_name', env.instance_name)

region_result = env.lookup_metadata "instance", "region"
region = region_result&.split('/')&.last
Honeycomb.client.libhoney.add_field('gcp.instance_region', region)

Honeycomb.client.libhoney.add_field('gcp.instance_zone', env.instance_zone)
Honeycomb.client.libhoney.add_field('gcp.instance_machine_type', env.instance_machine_type)
Honeycomb.client.libhoney.add_field('gcp.instance_blog_tags', env.instance_blog_tags)
Honeycomb.client.libhoney.add_field('gcp.knative_service_id', env.knative_service_id)
Honeycomb.client.libhoney.add_field('gcp.knative_service_revision', env.knative_service_revision)
Put this code somewhere that is loaded on app start up.
For rack-based frameworks like sinatra this is the config.ru, where we include this code through require.
At the same time, we can also add private configuration flags from our service, to track their influence.
For example, to capture whether FLAG_ENABLED has been set in the container’s variables:
Honeycomb.client.libhoney.add_field('flag_enabled', ENV['FLAG_ENABLED'] == 'true')
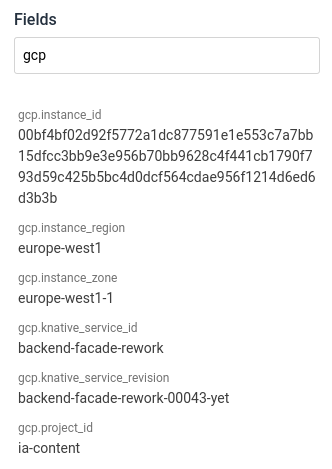
The attributes show up in the trace/span sidebar and can be used in any query:
Dynamic Data
For the actual system metrics, like CPU and memory usage, libhoney offers builders and dynamic fields (API docs). Dynamic fields get evaluated at the start of each span[1] and added to the fields sent to Honeycomb.
To access the current Resident Set Size (RSS, “memory in use”) we use the get_process_mem gem:
require 'get_process_mem'
Honeycomb.client.libhoney.add_dynamic_field('global.memory_inuse_bytes', proc { GetProcessMem.new.bytes.to_i })
The total lifetime of the process can be calculated as the difference from the start time to now:
start = Time.now
Honeycomb.client.libhoney.add_dynamic_field('global.process_uptime_seconds', proc { Time.now - start }
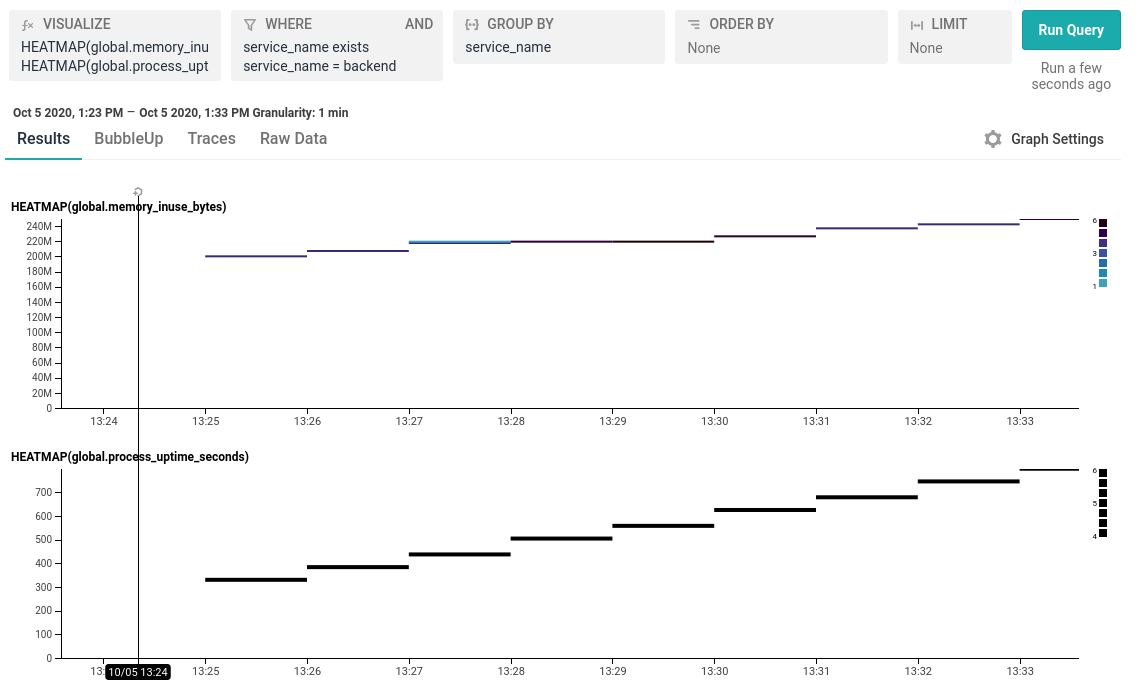
After a few minutes of the heartbeat API call:
Closing Notes
This post was written while implementing the first stab at collecting metrics. As we continue to improve our understanding of the capabilities and limitations of GCP, I expect we will have to revisit the exact metrics collected. For example, data written to disk in Cloud Run is stored in RAM and also counted against the service’s quota. This sounds like something to keep an eye on eventually.
Honeycomb recommends keeping system metrics in a separate dataset from application events. During development we currently have very little traffic on the service, so for simplicities sake, we keep everything global and attached to all events. We’ll have to revisit this once we get more traffic on the service.